You don’t need fancy software to get a grip on your finances. A personal finance dashboard in Google Sheets can do everything the paid apps do, and it’s completely free. Better yet, you control every formula, every category, and every data point. No subscriptions. No hidden fees. Just you and your spreadsheet.
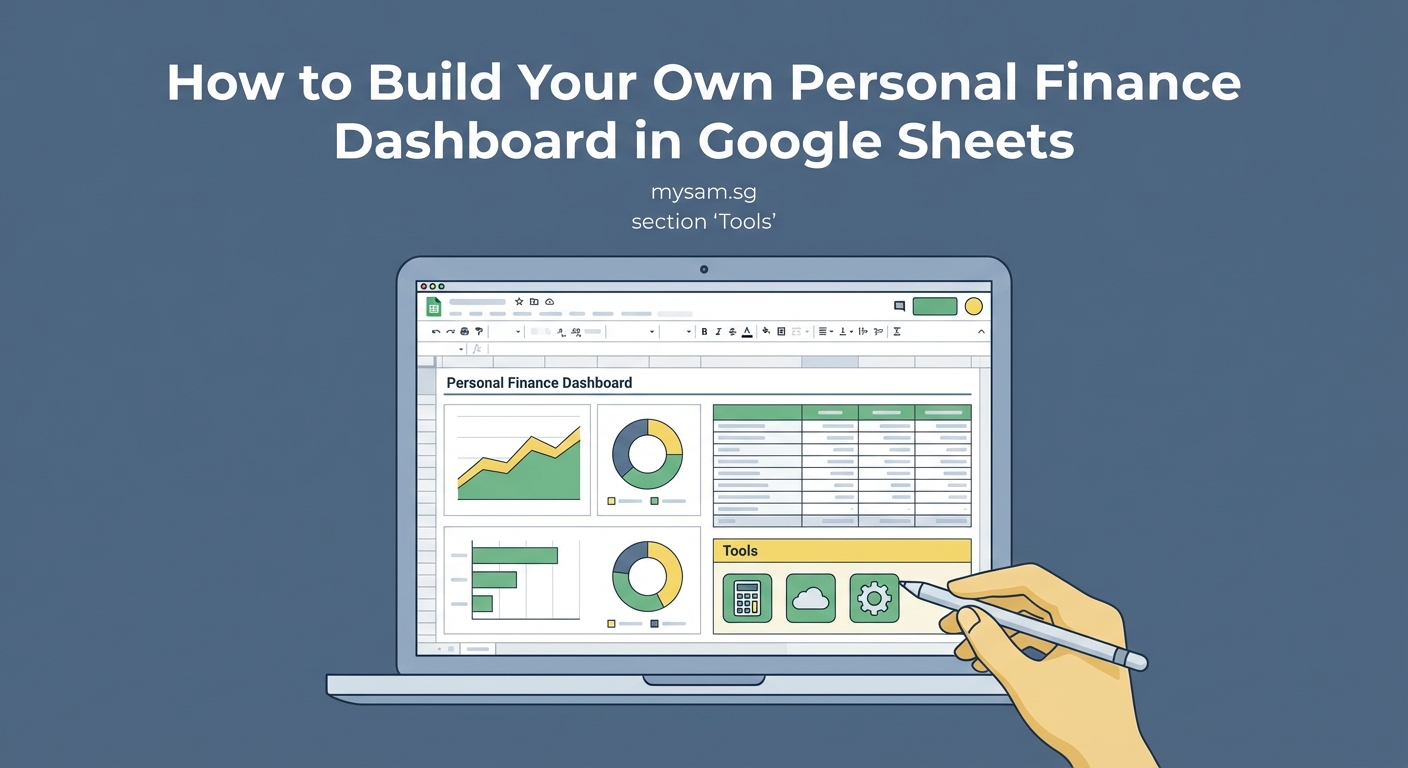
A personal finance dashboard in Google Sheets lets you track income, expenses, savings, and net worth in one place without paying for apps. By setting up simple formulas and charts, you gain full visibility into your spending patterns and financial health. This guide walks you through building your own dashboard from scratch, customized to your needs and accessible from any device.
Why build your own dashboard instead of using an app
Most budgeting apps charge monthly fees after a trial period. Some cost $10 or $15 per month. That adds up to $120 to $180 per year just to see your own money.
Google Sheets is free. It syncs across devices. You can access it from your phone, laptop, or tablet. And you own your data completely.
Apps also force you into their categories and rules. Your spending habits might not fit their preset buckets. Building your own dashboard means you decide what matters. You can track CPF contributions, SRS payments, or any Singapore-specific financial goal without workarounds.
Plus, learning spreadsheet skills pays off beyond personal finance. You’ll use these techniques at work, for side projects, or to help friends and family.
What you’ll need before you start

You need a Google account. That’s it.
Open Google Sheets and create a new blank spreadsheet. Name it something like “Personal Finance Dashboard 2024” so you can find it later.
You’ll also want to gather a few months of bank statements or transaction histories. This helps you understand your spending patterns and set realistic budget categories.
If you use multiple bank accounts or credit cards, have those statements ready too. You’ll consolidate everything into one view.
Setting up your basic structure
Start by creating separate sheets within your workbook. Think of each sheet as a different section of your dashboard.
Create these sheets:
- Dashboard (your main view)
- Income
- Expenses
- Savings
- Net Worth
To add a new sheet, click the plus icon at the bottom left of Google Sheets.
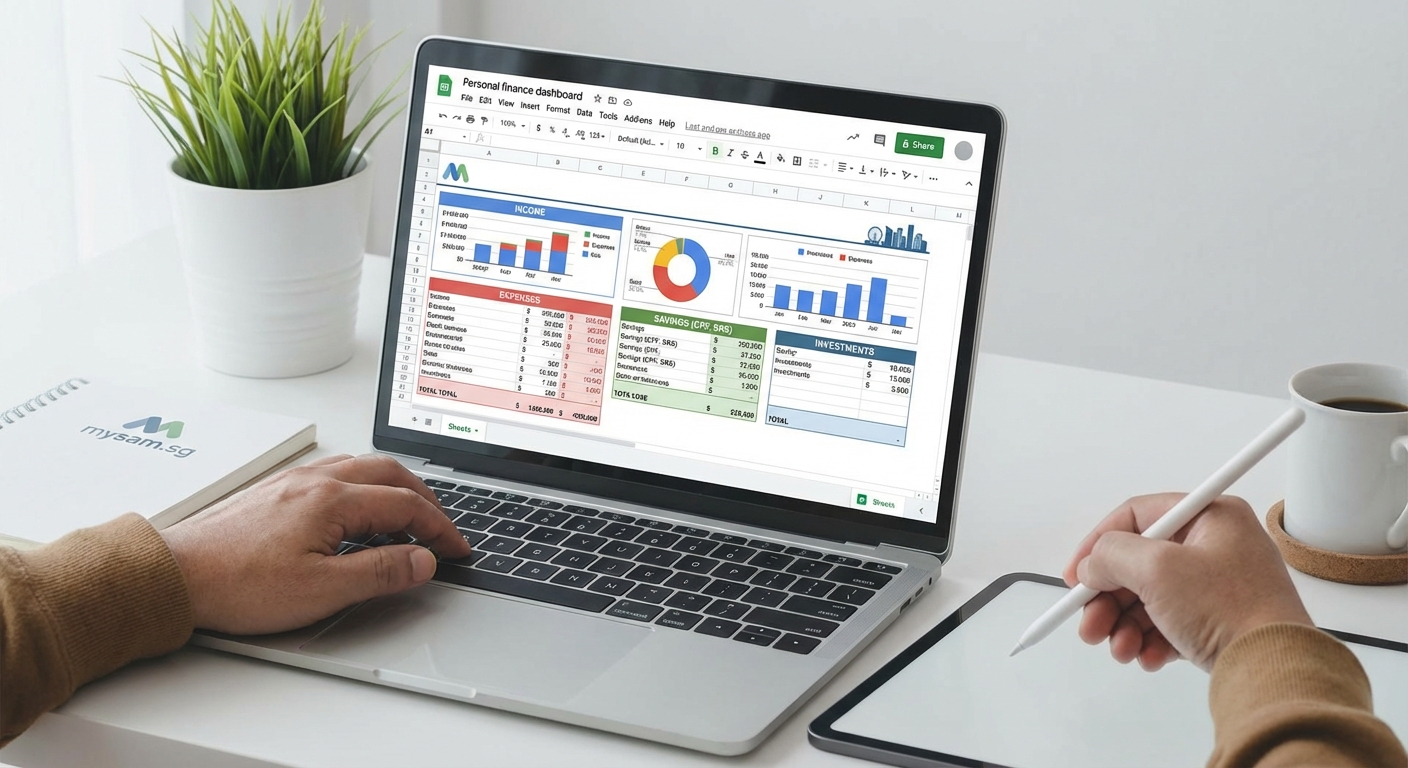
The Dashboard sheet will pull data from the other sheets and display it with charts and summary numbers. The other sheets hold your raw data.
This structure keeps things organized. You enter data in the detail sheets, and the Dashboard updates automatically.
Building your income tracker
Click on the Income sheet. Set up columns like this:
- Date
- Source
- Amount
- Category
- Notes
In the first row, type these headers. Make them bold so they stand out.
Now add your income entries below. Include your salary, freelance payments, investment dividends, or any other money coming in.
For the Category column, you might use labels like Salary, Bonus, Freelance, Investment Income, or Other.
At the bottom of the Amount column, use a SUM formula to total your income:
=SUM(C2:C100)
Adjust the range based on how many rows you think you’ll need. You can always extend it later.
Creating your expense tracker
The Expenses sheet is where most of your work happens. This is the heart of your personal finance dashboard in Google Sheets.
Set up these columns:
- Date
- Vendor
- Amount
- Category
- Payment Method
- Notes
Common categories for Singapore residents include:
- Food & Dining
- Transport
- Housing
- Utilities
- Insurance
- Healthcare
- Entertainment
- Shopping
- Education
- Personal Care
Add or remove categories based on your lifestyle. If you spend a lot on pet care, add that category. If you don’t drive, you might skip transport or keep it minimal.
Enter your transactions row by row. You can copy and paste from bank statements to speed this up.
At the bottom, add a SUM formula for total expenses:
=SUM(C2:C500)
Organizing with data validation

To keep your categories consistent, use data validation. This creates a dropdown menu so you don’t accidentally type “Food” one day and “food & dining” the next.
First, create a list of your categories somewhere on the sheet. Put them in a column off to the side, like column H.
Then select the Category column where you enter data. Go to Data > Data validation.
Set the criteria to “List from a range” and select your category list. Check “Show dropdown list in cell.”
Now every time you click on a Category cell, you’ll see a dropdown with your preset options. This keeps your data clean and makes filtering easier.
Building summary formulas
On your Dashboard sheet, you’ll create summary boxes that pull data from your other sheets.
Start with a simple income summary. In cell B2, type “Total Income This Month.”
In cell C2, use a SUMIFS formula to total income for the current month:
=SUMIFS(Income!C:C, Income!A:A, ">="&DATE(YEAR(TODAY()),MONTH(TODAY()),1), Income!A:A, "<"&DATE(YEAR(TODAY()),MONTH(TODAY())+1,1))
This formula adds up all amounts in the Income sheet where the date falls within the current month.
Do the same for expenses. In B3, type “Total Expenses This Month.”
In C3:
=SUMIFS(Expenses!C:C, Expenses!A:A, ">="&DATE(YEAR(TODAY()),MONTH(TODAY()),1), Expenses!A:A, "<"&DATE(YEAR(TODAY()),MONTH(TODAY())+1,1))
In B4, type “Net Savings This Month.”
In C4:
=C2-C3
Now you have a real-time view of your monthly financial picture.
Adding category breakdowns

You probably want to see how much you spend in each category. This helps you spot areas where you’re overspending.
Create a table on your Dashboard sheet:
| Category | Amount |
|---|---|
| Food & Dining | =SUMIF(Expenses!D:D,”Food & Dining”,Expenses!C:C) |
| Transport | =SUMIF(Expenses!D:D,”Transport”,Expenses!C:C) |
| Housing | =SUMIF(Expenses!D:D,”Housing”,Expenses!C:C) |
Replace the formula text with actual formulas in your sheet. The SUMIF function adds up all expenses where the category matches.
You can copy this formula down for each category you track.
Creating visual charts
Numbers are great, but charts make patterns obvious at a glance.
Select your category breakdown table. Click Insert > Chart.
Google Sheets will suggest a chart type. A pie chart works well for showing how your spending breaks down by category. A bar chart is easier to compare exact amounts.
Customize the chart title to something like “Monthly Spending by Category.” Remove the legend if it’s redundant. Adjust colors to make it readable.
Move the chart to a prominent spot on your Dashboard sheet.
Create another chart for income vs. expenses over time. This requires a monthly summary table:
| Month | Income | Expenses |
|---|---|---|
| Jan 2024 | 5000 | 3500 |
| Feb 2024 | 5200 | 3800 |
| Mar 2024 | 5000 | 3200 |
You can populate this table manually each month, or use more complex formulas to auto-calculate based on date ranges.
Select this table and insert a column or line chart. This shows your financial trend over time.
Tracking net worth
Net worth is your total assets minus your total liabilities. It’s the big-picture number that shows if you’re moving forward financially.
On your Net Worth sheet, create two sections: Assets and Liabilities.
Assets include:
- Cash in bank accounts
- CPF balances (Ordinary, Special, Medisave)
- Investment accounts
- Property value
- Other assets
Liabilities include:
- Credit card debt
- Personal loans
- Mortgage balance
- Other debts
List each item with its current value. Update these monthly.
At the bottom, sum your total assets and total liabilities. Then calculate net worth:
=Total Assets - Total Liabilities
On your Dashboard, pull this number so you see it every time you open the sheet:
='Net Worth'!C20
(Adjust the cell reference to wherever your net worth calculation lives.)
Watching this number grow month by month is incredibly motivating.
Automating with Google Forms
Entering transactions manually gets tedious. You can speed this up with a Google Form.
Go to Google Forms and create a new form. Add fields for:
- Date
- Vendor
- Amount
- Category (make this a dropdown with your categories)
- Payment Method
- Notes
Link this form to your Expenses sheet. Go to Responses > Create Spreadsheet > Select existing spreadsheet, then choose your finance dashboard.
Now you can log expenses from your phone by filling out the form. The data flows directly into your sheet.
You’ll need to do some cleanup because the form creates a new sheet. You can either work directly from that sheet or use formulas to pull the data into your main Expenses sheet.
Common mistakes to avoid
Here’s a table of pitfalls and how to sidestep them:
| Mistake | Why it happens | How to fix it |
|---|---|---|
| Inconsistent categories | Typing categories manually leads to variations | Use data validation dropdowns |
| Forgetting to log expenses | Life gets busy | Set a daily reminder or use Google Forms |
| Overcomplicating formulas | Trying to automate everything at once | Start simple, add features gradually |
| Not backing up data | Assuming Google saves everything forever | Download a copy monthly as backup |
| Mixing personal and business | Using one sheet for everything | Create separate dashboards or sheets |
The biggest mistake is perfectionism. You don’t need every feature on day one. Start with basic income and expense tracking. Add charts and automation as you get comfortable.
Advanced features to add later
Once your basic personal finance dashboard in Google Sheets is running smoothly, consider these upgrades:
Conditional formatting highlights cells that exceed budget limits. If your food spending goes over $500, the cell turns red automatically.
Budget vs. actual tracking compares what you planned to spend against what you actually spent. Create a budget column next to each category, then add a variance column that subtracts actual from budget.
Savings rate calculation shows what percentage of your income you’re saving. Use this formula:
=(Income - Expenses) / Income
Format it as a percentage. Aim for 20% or higher if possible.
Investment tracking monitors your portfolio performance. Add columns for purchase price, current price, and gain/loss. Link to Google Finance functions to pull live stock prices.
Goal tracking creates progress bars for specific savings goals like a house deposit, vacation, or emergency fund. Use a simple formula to show percentage complete.
Keeping your dashboard up to date
A dashboard only helps if you use it. Set a routine.
Daily: Log expenses. This takes two minutes if you do it right after spending.
Weekly: Review your spending patterns. Are you on track for the month?
Monthly: Update your net worth. Add new income and expense data. Check if you hit your budget targets.
Quarterly: Review your categories. Do they still make sense? Adjust your budget based on what you learned.
Annual: Look at year-over-year trends. Celebrate your wins. Identify areas for improvement next year.
“The best financial system is the one you’ll actually use. Keep it simple enough that updating it doesn’t feel like homework, but detailed enough that you gain real insight into your money habits.”
Sharing and collaboration
If you manage finances with a partner, Google Sheets makes collaboration easy.
Click the Share button in the top right. Add their email address. Set permissions to Editor so they can add transactions too.
You’ll both see updates in real time. No more wondering if your partner logged that restaurant bill.
If you work with a financial advisor, you can share view-only access. They can review your numbers without editing anything.
Troubleshooting common issues
Formulas showing errors? Check that your cell references point to the right sheets and columns. A #REF! error means you’re pointing to a cell that doesn’t exist.
Charts not updating? Right-click the chart and select “Edit chart.” Make sure the data range includes all your rows.
Slow performance? If your sheet has thousands of rows, Google Sheets might lag. Consider archiving old data to a separate sheet for each year.
Can’t access on mobile? Download the Google Sheets app. It works better than the mobile browser version.
Making it work for Singapore finances
If you’re based in Singapore, customize your dashboard for local needs.
Add CPF tracking with separate rows for Ordinary Account, Special Account, and Medisave. Update these monthly after your contribution posts.
Track SRS contributions if you use the Supplementary Retirement Scheme. This helps you maximize your tax relief.
Include GST in your expense amounts. You might add a column to note GST separately if you need it for business expense claims.
For property owners, track your mortgage amortization. Each month, part of your payment reduces principal and part pays interest. Knowing this helps you see how your equity builds.
Your money, your rules
Building a personal finance dashboard in Google Sheets gives you complete control. No algorithm decides what you should see. No company sells your spending data. No subscription fee drains your account every month.
You built this system. You understand every formula. You can tweak it whenever your life changes.
Start simple today. Open a new Google Sheet. Add your income and expenses from last month. Create one chart. Watch your net worth grow.
Your financial clarity starts with one spreadsheet and one decision to take control.